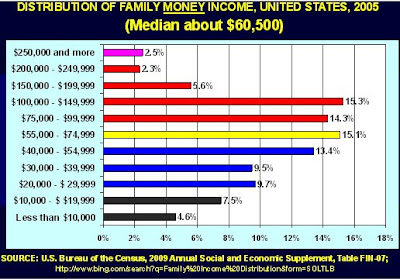
I found this (now-purloined) graph prepared by an economist writing about health care in the United States in the New York Times. His purpose was much different than mine. I’m reproducing it to show how politicians blatantly lie every time they say they’re going to tax the wealthy and leave the middle class alone. Yeah, right. All the money is in the middle, as the graph clearly shows (totals include cost of benefits and Social Security/Medicare contributions borne by employee and employer):
Options
- Contact Us
- Compliance 101A
- Five Labor Law Posters Every Business Must Display
- Seven Types of Illegal Interview Questions You Should Never Ask
- Ten Tips for Managing Remote Employees
- Six Common Workplace Hazards to Find and Fix Now
- Five Effective Ways to Promote Diversity in the Workplace
- The Five Types of Employee Records All Employers Must Keep
Recent Posts
- Nationwide Staffing Agency to Pay $2.2M in EEOC Hiring Discrimination Lawsuit
- DOL Joins Other Agencies in Call for Fair and Equal Artificial Intelligence Usage
- Labor Department Issues Final Rule on Employee Representation During OSHA Inspections
- DOL Releases Resource to Increase Employment for People with Disabilities
- Federal Court Strikes Down Latest Joint Employer Rule as “Overbroad”